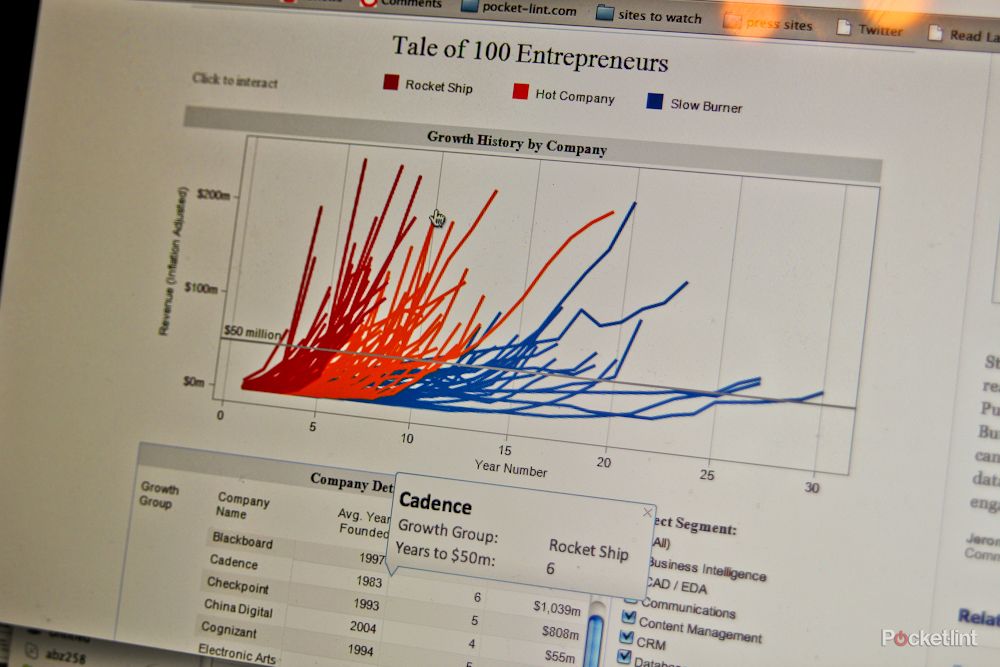
Data is boring. A stack of figures in a spread sheet that doubtless tell you a wealth of information, but only if you can be bothered to work out what it's saying.
“Yes, it’s hard to put data online that’s easy to understand,” a rather excitable Christian Chabot, CEO and co-founder of Tableau software, explains to Pocket-lint in a London hotel, a stones throw from the Houses of Parliament.
Chabot is in town to launch the UK office of what he describes as, “the fastest growing analytics company in the world.”
Tableau Software, already used by companies like, Apple, Zynga, Oxford University, Bungie and Microsoft allows its users to dive deep into data to see what’s happening by quickly changing the format or the way that the data is presented.
Analytics and stats might sound dull unless you’re an accountant, but to Chabot, if done right, they are about empowering us to understand more.
“We are trying to create a category for data blogging,” says Chabot, hoping to change the world through the medium of numbers. “Data is just another content type. We're trying to be the YouTube for data.”
Chabot, who studied at Stanford, believes that data should be fun - just like the Flip pocket camcorder - and Tableau is all about creating analytics that are both easy to play with and easy to create as long as you’ve got the data.
The premise is a piece of software for the PC (a Mac version is promised) that will let you import any table of data and create interactive info graphics that would wow anyone at the press of a button, without having to learn any code. In fact, Chabot tells us that as long as you've got Excel level competency you should be fine.
“A good graphic should have three goals: Firstly to help the audience answer a question, second to help tell a story, and thirdly to start a conversation.”
To do that Chabot and his other founders believe that you’ve got to make creation and sharing easy.
It shouldn’t come as a surprise then that the public free version of the Tableau software comes with a way to easily create an embed code similar to YouTube videos, so users can quickly and easily share the data with other readers once they’ve created it.
“People are getting really passionate about data,” adds the CEO. “This software allows you to take dull boring data and turn it into something interesting.”
So far that means everything from analysing fantasy football stats each week to, “hard geeky corporate data” to which country is the worse to visit if you’re trying to avoid being abducted by aliens (Chabot tells us it’s India by the way).
Access to the software, the data and info graphic hosting is completely free with the proviso that you share the data with the public.
For those keen to keep that data private, then there is a fee to pay and prices vary on whom you are and what you are planning to do with it.
One example of a company internally using the Tableau software to enhance their product is Bungie, the makers of the Halo franchise on the Xbox 360.
Before we even open our mouth to ask how a games developer would use analytics software in creating games, Chabot is already answering our questions with psychic ability:
“All these games exhume massive levels of data via log files. Bungie uses that data with Tableau to see where people succeed or fail in game,” explains Chabot.
“If it’s too easy or too hard people turn off. The data showed where people died in a particular level of the game and that too many people where dying in that spot. Bungie were then able to change the game and stop that from happening because the data easily showed them.”
Of course gaming is just one way to use the software says Chabot, with web analytics probably the biggest sector that they supply to as website managers look to understand the way people use their websites, beyond the basic data services that Google Analytics offers.
While big business deals have allowed Tableau to grow massively since Chabot spun the company out of Stanford University in 2003, it’s clear from our 45 minutes with the founder that empowering the public is where his heart lies.
“We want to be the standard for info graphics,” says Chabot looking to the future, hoping that everyone will have the same passion for data as he does.
While it’s unlikely you’ll have that Stanford degree in engineering, and years of experience being an analyst like Chabot, there is one thing that our whistle stop interview with an American, who is very passionate about what he does, has shown us; that if you can make data exciting then there is a greater chance of finding the hidden gems within the numbers - “Matrix style” - that current boring spreadsheets are never going to achieve.
Tableau is hoping to arm a legion of stats nerds into making data fun, and as long as you’ve got the numbers to start with, Tableau’s tools should make that a possibility. So, maybe accountants have the power to be sexy after all.
- iOS massively outshines Android in Europe - but BlackBerry clings on in UK


